Saturable absorbers nonlinear transmission
Introduction
The gaussian beam – the basic mode of the open spherical resonator – is described by following parameters:
 Fig. 8.1: The gaussian beam close its waist.
- beam radius
- w(z) = w0 sqrt(1+(z/z0)2)
- beam divergention
- Θ0 = 2 λ / (π w0)
- confocal parameter
- b = 2 z0 = 2 π w02 / λ
- curvature radius
- R(z) = z (1+(z/z0)2)
where λ is a wavelength, w0 is a beam radius in waist, and z0 is the Rayleigh range. For more details see linked reference below.
Saturable absorber
A saturable absorber (SA) is an optical medium with a strong nonlinearity of transmittance depending on the intensity of the incident radiation. In other words, the optical medium absorps the high intensity less than the low intensity. Or the medium becomes more transparent as the intensity of the incident light radiation increases. An increase of SA transmittance can be also called bleaching or brightening.
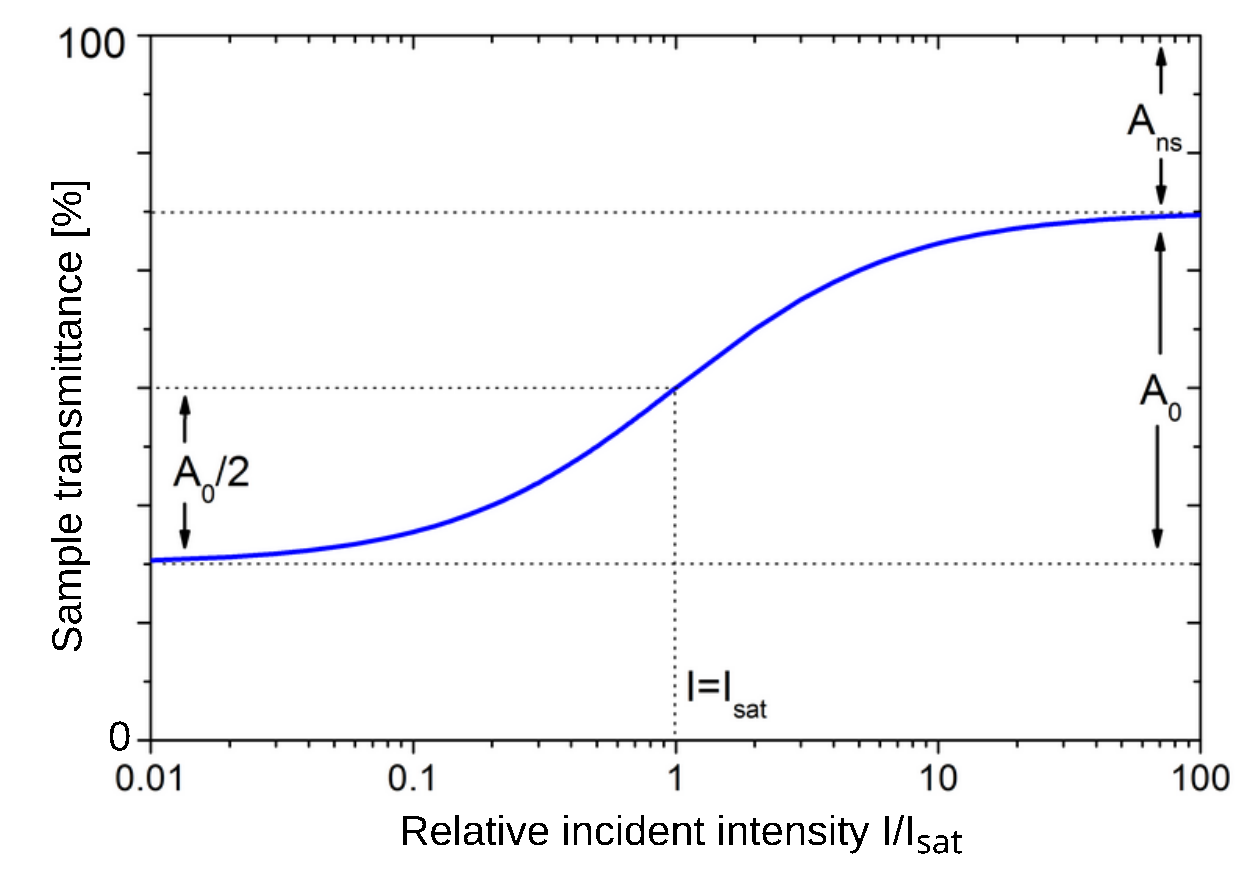 Fig. 8.2: The sample transmittance as a function of relative intensity plotted in semi-logarithmic scale.
A saturable absorber is characterized by three basic parameters: depth of modulation (A0), saturation intensity (Isat) and non-saturable losses (Ans). Assuming a two-level model of SA, the intensity-dependent absorption A(I) can be described by the following relation:
- A(I) = Ans + A0/(1+I/Isat)
The modulation depth (of saturable absorption) is describing the difference between maximum and minimum SA transmission. Non-saturable losses represent a constant level of losses that cannot be saturated. Non-saturable losses Ans can include both Fresnel losses (reflections) on the sample surfaces, and e.g. losses caused by light scattering inside the sample. The saturation intensity Isat is defined as the intensity of the incident radiation at which the saturable absorption drops to half of its maximum value. (see Fig. 8.2)
The transmittance of the sample can then be calculated according to the relation:
- T(I) = 1 − A(I)
Goal
Measure and compute beam parameters using technical specification of laser and measure saturable intensity of absorber samples.
Instructions
Laser parameters determination
- Measure average laser output power PAVG using wattmeter.
- Measure time lenght TP and repetition rate f of laser output pulses using photodiode and oscilloscope.
- From measured values calculate energy in one laser pulse EP and peak power PP assuming pulse lenght 810 ps (FWHM, not rms) as listed in laser specifications.
- Compare measured and calculated values with technical specifications. Clarify difference between measured and specified value of TP.
Fig. 8.3: Principal optical scheme for nonlinear transmission measurement.
LiF:F−
2
crystal nonlinear transmission determination
- Place absorber sample on linear translation stage close to focussing lens (point A on fig. 8.3) and using wattmeter determine power as a function of sample position up to point B, roughly 30 cm from lens.
- Experimentally find the position of beam focus as a position where maximal power is transmitting through the sample. Measure the sample transmittance as a function of range from focus up to point B using wattmeter. Close to the waist use small steps in distance, far away from waist the steps can be bigger.
- Repeat previous measurement but insteed of wattmeter use photodiode and oscilloscope..
- Calculate confocal parameter b and Rayleigh range z0 in the waist. For this calculation assume minimal beam radius in waist w0 to be 75 µm.
- Calculate power density for all used sample positions.
- Plot measured dependences of transmissions as a functions of range and a function of power density, determine value of saturable intensity, depth of modulation, and nonsaturable losses assuming that the maximum transmission was really reached. Repeat this point for both detectors.
Requested results
- Optical scheme of Nanolase microchip laser resonator.
- Comparison table of measured and specified laser parameters (EP, PP, PAVG, f, TP).
- Table of masured transmission for both samples.
- Plots of nonlinear transmission for both detectors as a function of measured range from focus and as a function of calculated power density.
- List for both samples of values of saturable intensity, nonsaturable losses, and depth of modulation.
- Table of laser beam radii and power densities for waist, z0, 10 cm, and 30 cm.
References
- Melles Griot - Beam waist and divergence
- http://experimentationlab.berkeley.edu/sites/default/files/MOT/Gaussian-Beam-Optics.pdf
- Shen, Y.R., The Principles of Nonlinear Optics.
- nonlinear crystal theory
Czech Technical University in Prague - Faculty of Nuclear Sciences and Physical Engineering
Brehova 7, 115 19 Prague 1, Czech Republic