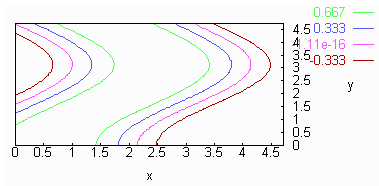
plot(sin(x+cos y), x=(0 .. 3*pi/2), y=(0 .. 3*pi/2),
contour,nosurface,view="0,0");
plot_xmesh:=plot_ymesh:=40;

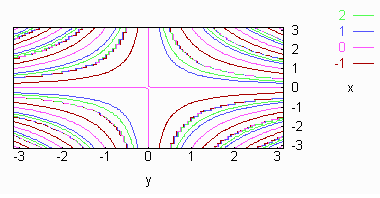
plot(tan(x*y), x=(-pi .. pi), y=(-pi .. pi), z=(-3 .. 3),
contour,nosurface,view="0,0");
plot_xmesh:=plot_ymesh:=80;

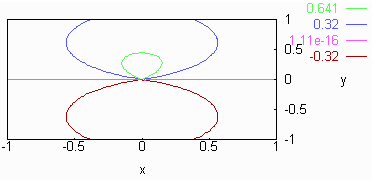
plot(e
plot_xmesh:=plot_ymesh:=30;
^(-sqrt(x^2+y^2))*cos(atan(x/y)), x=(-1 .. 1), y=(-1 .. 1),
contour,nosurface,view="0,0");

